
Cautionary Income Analytics: Rio Tinto to Interim 2021
Cautionary Income Analytics: Rio Tinto to Interim 2021

Summary
For investors and retirees seeking income solutions, high-yield stocks may be appealing.
However, reaching for yield to boost income may carry added risk. Is the risk worth it?
This cautionary income series centers on high-yield stocks using a proprietary modeling methodology.
The tentative findings for RIO suggest a slightly positive adjusted yield and a higher ranking relative to precious metals mining (SIC 1040).
Preliminary Results: Metrics
1. Coverage capacity of financing obligations is estimated at 0.53 (range 0-1), with recent financing obligations at about 21% of revenues.
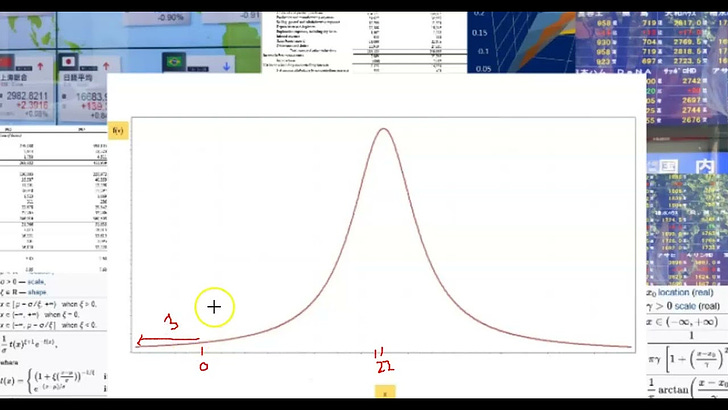
2. Exposure to a negative cash flow scenario is estimated at 0.03 (range 0-1).
3. Centrality of the cash flows is estimated at 22% of revenues.
4. Potential for coverage based on maximum acceptable exposures of 0.05 and 0.10 (MAE 0.05, MAE 0.10) are approximately 7.6% to 14.9% of revenues, respectively, depending on the model assumptions.
Capacity Tier and Ranking (estimate): 2.4 unfiltered, 2.4 filtered (Range: 1.0 to 4.0).
Adjusted Yield Estimate. Positive leaning based on current yield; financing obligations concerns noted.
Notes: See Summary of Definitions and Qualifications below. The SIC code for Rio Tinto Group (RIO) is 1000 (metals mining). The stock dividend yield is currently approximately 8.8% (trailing). Estimates stated above may vary according to model assumptions, may be rounded and are not forecasts.
Comparative Analysis (“Comps”)
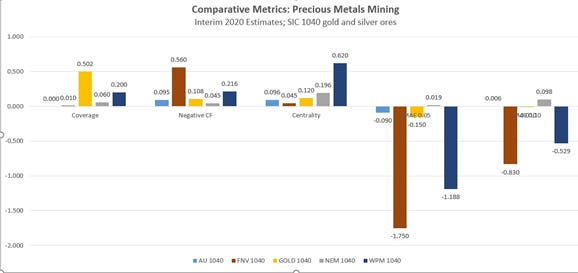
The closest SIC code counterpart available is precious metals mining (SIC 1040 gold and silver ores). Note that while some firms’ SIC classification codes may be similar or even identical, their comparability may be limited due to significant differences within industries.
The chart next compares the metrics of five companies in the SIC 1040 category as of interim 2020. RIO (not shown in the chart) most closely resembles Barrick Gold (GOLD) for metric 1 (financing obligations coverage), while for metrics 2-5 is most similar to Newmont Mining (NEM); overall RIO appears to surpass these miners’ metrics and rankings. For detail on interpretation of the metrics see the Summary of Definitions section below.
Related Videos and Reports
Video: Individual Firm Analysis of RIO to interim 2021
Below are links for gold/precious metals miners (SIC 1040).
Video (Gold Miners SIC 1040 to Interim 2020)
Reports https://seekingalpha.com/instablog/471740-raoul-kennedy/5622983-dividend-coverage-roundup-gold-mining-industry-rankings-to-2020
https://seekingalpha.com/instablog/471740-raoul-kennedy/5515416-dividend-coverage-roundup-gold-miners-interim-2020
Summary of Definitions
Metrics are estimates. For metrics 1 and 2, the range is 0-1; for metrics 3, 4 and 5, the estimates refer to a cash flow measure (net free cash flow) as a percentage of revenues (e.g. 0.07 =7% of revenues). Coverage capacity refers to capacity to cover financing obligations FO i.e. the sum of debt repayment and dividends. Metric 1 uses current financial obligations to estimate coverage. Metrics 4 and 5 are estimates of a theoretically adequate level of financing obligations (as a percentage of revenues) based on maximum acceptable exposure MAE criteria of 0.05 and 0.10, respectively. This estimate can be negative which means the firm may in theory be unable to cover any amount of financing obligations based on the MAE criteria. Rankings. The tiers are 1, 2, and 3, with rankings from 1.0 to 3.99 (rounded); an estimate of 1.0 suggests the strongest possible performance; estimates of 4.0 and greater fall below the criteria for the top three tiers. For more on the cautionary methodology and dividend coverage capacity rankings, refer to the author bio and references.
Adjusted Yield. This metric should be viewed as a rough approximation. The current annual dividend yield is adjusted by a risk factor represented by the company’s estimated exposure to negative cash flow; the resulting margin is characterized as leaning positive, breakeven, or negative. The company’s coverage metric (metric 1) incorporating financing obligations may further reduce the adjusted yield. Also see qualifications, next.
Qualifications
The following important factors are not accounted for in the estimate of adjusted yield: Dividend cuts, exchange rate risk, phases in the business cycle, market risk, geopolitical factors, inflation, interest rate, data quality, debt default and other risks, all of which may play an important role in assessing whether on net a loss will be incurred. Note that while some firms’ SIC classification codes may be similar or even identical, their comparability may be limited due to significant differences within industries. In some cases, SIC codes may differ considerably but due to business changes over time, may be reasonably classified as within the same industry. Also note that comparative analyses of firms may not be for uniform time periods and interim data may be subject to significant changes.
These results are currently shared as a public service; if helpful, consider paying it forward by adding something extra to any donations made to reputable charities, preferably with priority given to the most vulnerable, including defenseless animals. Organizational reputations may be researched through sites such as charitynavigator.org.
The author may also hold positions in securities of companies, including through ETFs, that are covered herein. The discussion and any visuals may contain significant errors, are subject to revisions and are provided 'as is' solely for informational purposes, not for trading or investment advice. This preliminary analysis is exploratory; no claims are made as to the validity of data, assumptions, theoretical models, and methodologies; results may be based on prior data that do not reflect the most current market or other events.
References
Kabir, Usman., “10 Dividend Stocks with Over 10% Yield,” Yahoo! Finance, November 6, 2021 https://finance.yahoo.com/news/10-dividend-stocks-over-10-164759723.html (originally published on Insider Monkey).
Kennedy, Raoul., Debt Management Analytics ; Dividend Coverage Analytics, 2021.
Wallstreetzen stock screener https://www.wallstreetzen.com/stock-screener/dividends
Update: For the report on VALE, S.A. (VALE) and comparative analysis of metals miners (SIC 1000) see https://raoulkennedy.substack.com/p/cautionary-income-analytics-vale