

Epidemiological Notes: Mass Testing and the Coding of “Positives”
Epidemiological Notes: Mass Testing and the Coding of “Positives”

Summary
This study centers on the relationship between deaths coded from tested “positives” and all-cause mortality (2020-2022).
This relationship is examined over the two-plus years from February 2020 to March 2022 in Japan, although additional commentary is country non-specific.
For additional reports on other countries including South Korea (Berenson 2022) and Taiwan (Chudov 2022), see the Comments section or References.
Timeline (Chart 1). The following chart shows the daily deaths coded from tested “positives” as a percentage of daily average all-cause mortality (ACM) from February 19 2020 to March 19 2022, together with timeline indicators of key events in red font. The x-axis shows the dates of the series, totaling 760 data points. The y-axis is the percentage of deaths coded from “positive” test results such as RT-PCR as a percentage of the average daily total deaths by all causes.
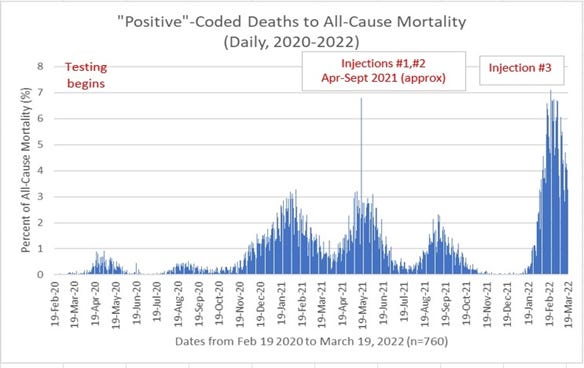
The timeline is divided into three major sub-periods or phases:
1. Testing (Early) (beginning with the data reporting on February 19, 2020). This period was marked by mass media amplification of the “positives” results, redefining “positives” to mean “cases” (also see the Clarifications and Shortcomings section below on the coding of “positives.”)
2. (Mass) Injections: Injections #1 and #2 refers to the public rollout period approximately April through September 2021 (although the earliest injections appear to have been administered on a limited basis for healthcare and other personnel beginning February 2021). Also, on August 13 2021 Japan reportedly relaxed restrictions on use of Ivermectin for treatment; this has been attributed to a possible decline in “positives/cases” beginning two weeks later (Campbell, 2021). For more on issues surrounding coding and “positives” see the Clarifications and Shortcomings section.
3. Injection #3 (aka “booster” beginning in February 2022).
Peaks. A first peak of 3.8% of all-cause mortality was recorded in early 2021 (January 18 and February 20); this early peak is referred to as the baseline in subsequent discussion below. A second peak occurred shortly after the start of the first series of mass injections on May 18, 2021 at 6.79% of ACM, seen as a single towering line approximately at the center of the chart). During the 3rd injection period beginning approximately February 2022, there has been a cluster of values near the May 18 2021 peak with a maximum of 7.1% on February 22 2022. This dataset ends on March 19 2022.
Distributions and Key Metrics
The distributions are divided by the sub-periods described in the previous section; the distributions selected presume fat-tailed characteristics that aim to derive more cautious exposure estimates (Fréchet).
Sub-period 1. Early Testing Phase (beginning with the data reporting on February 19 2020 to April 30 2021 approximately prior to the beginning of the mass injection rollout).
Sub-period 2. (Mass) Injection Phase: Injections #1 and #2 from May 1 2021 to January 30 2022. This phase primarily refers to the mass public rollout period (approximately April through September 2021) although as noted above the earliest injections appear to have been administered on a limited basis for healthcare and other personnel beginning mid-February).
Sub-period 3. Injection Phase #3 beginning February 1 2022 to the most current data as of March 19 2022.
The x-axis of each theoretical distribution shows daily “positive”-coded fatalities as a percentage of average daily all-cause mortality; for example, on the x-axis the figure “1” would refer to 1% of total daily average deaths being “positive”-coded as Covid-19. For reference, over the two-year plus period from February 19, 2020 to March 19 2022 this figure ranges from a minimum 0%, to a maximum of 7.1% on February 22, 2022 after the start of the third sub-period.
Chart 2. Sub-period 1: Early Testing Phase (February 19 2020 to April 30 2021)

Chart 3. Sub-period 2: Injections #1 and #2 May 1 2021 to January 30 2022

Chart 4. Sub-period 3: Injection #3 February 1 2022 to March 19 2022

Relative Spatio-temporal Centrality (RSC). For the first two sub-periods, RSC (abbreviated centrality) is estimated at between 0.24% (i.e. ¼ of 1% of all-cause mortality) and 0.304% (Fréchet). For the last sub-period (Sub-period 3 Injection #3, Chart 4 above) this RSC estimate jumps to 4.36% of ACM, a 14 -fold increase over the maximum previous sub-period of 0.304%.
Exposure Metrics. Four estimates of exposure above a given value are made as follows:
1. Exposure >3.28% of ACM (Baseline). Recall that this was a maximum established in Jan-Feb 2021 during the early testing phase, used as a baseline here.
2. Exposure >32.8% of ACM. This represents an order of magnitude increase over the baseline of 3.28% (#1 above, or 3.28%x10).
3. Exposure >50% of ACM. This describes a hypothetical scenario in which “positive”-coded deaths exceed half of all-cause mortality.
4. Exposure >99.9% of ACM. This describes a hypothetical scenario in which “positive”-coded deaths exceed 99.9% of all-cause mortality.
Table 1. The estimates for both RSC and exposure metrics for each of the sub-periods are summarized in the following table.

Interpretation. Sub-period 3 which corresponds to the 3rd round of injections is very distinct from the other sub-periods, both in terms of centrality and exposure estimates. Moderate increases in some exposure metrics from sub-period 1 to sub-period 2 are seen, but a major shift occurs in sub-period 3 with an estimated 78% of outcomes expected to exceed 3.28% of all-cause mortality. Interestingly, for the remaining three exposure metrics (>32.88%, >50%, and >99.9%) the distributional characteristics for sub-period 3 suggest less tail obesity than for the other periods, to such a degree that the exposure estimates result in nearly zero possible outcomes. Moreover, for reasons unknown, the best fitting distribution (Wakeby, not shown here) has a maximum possible value of 7.33 (rounded), a clearly established cap.
Commentary. The reasons for the marked change observed in sub-period 3 compared to the other periods are not clear. In additional to routine seasonal factors (e.g. additional debris from flus and colds, etc., being detected as “positives”), another explanation may be an upward calibration of the cycle threshold values (Ct values) of the PCR tests which might be expected to yield more positives than otherwise; the reasoning behind a re-calibration is not known. It is also possible that the injections play a role (re: Kirsch 2021 in reference to the Burkhardt autopsies, or other pathologies as identified by Klok, et al. 2022). Possible immune system depletion resulting from injections and resulting pathogenicity is also a concern (re: Murphy and Longo 2022). The existence of such adverse events leads to a possible source of confusion: Injection-induced immune deficiency could render injectees more vulnerable to illness and infection (including coronaviruses) and the likelihood of being coded as “positive,” obscuring the underlying cause which may be the injections; further investigation on this possibility may be warranted. Also see data shortcomings in the next section.
Clarifications and Shortcomings
Distributions. Note that goodness-of-fit distribution fitting results for the selected distribution used in a study may be inferior to higher-ranking thinner-tailed distributions, but the importance of a conservative estimate is deemed to outweigh higher ranked fits.
All-Cause Mortality (ACM). The ACM is an average daily figure based on country death rate per 1000 population (re: World Population Review for 2020 and Macro Trends for 2021). In Japan the incidence of all-cause mortality is a daily average of approximately 3700 and 3800 in 2020 and 2021, respectively. To illustrate this relationship, in 2021 a reported figure of 38 daily “positive”-coded deaths would result in 38/3800 or 1% of daily average all-cause mortality. Because the “positives” are reported daily figures and not averages, comparing them to a daily average of all-cause mortality introduces a bias that overstates the ratio of positives to ACM when ACM is in fact elevated, while understating the ratio when ACM is in fact low. An alternative computation is made to compare the variables when they are both averaged. The average positive-coded deaths range between 23 to 52 daily, with an average for the entire period from February 2020 to March 2022 of 35 per day. The resulting ratio (%) of “positive”-coded relative to ACM ranges between 0.006 (0.6%) and 0.014 (1.4%), with an average for the entire period from February 2020 to March 2022 of 0.0094 (0.94%). These averaged ratios can roughly be compared to the figures for centrality in Table 1 above: 0.24, 0.30 and 4.36 for sub-periods 1, 2 and 3, respectively.
Coding based on “Positives.” Positive results from testing are often confused with diagnosis of an illness. The public may have been deceived by the redefining of “positives” as “infections” or “cases,” implying an association with disease. This strategy of widespread testing could have misled many given that what was “detected” was not a disease or disease-causing agent but markers based on a predetermined sequence (or set of sequences) of genetic material which may include viral debris and dead nucleotides. Moreover, analysis of such “positive” samples does not support the thesis that a “positive” result predicts the presence of target genetic material within cells (re: Jaafar, et al., 2020; Bullard, et al., 2020). Cycle Threshold (Ct) values are another variable in the number of “positives” reported. Ct values correspond to the number of cycles to amplify the genetic material obtained. Amplification can be misleading by turning a minute quantity of targeted item(s) into a large quantity that is defined as “detection” of a “positive.” The setting of these Ct values can also be used to alter the frequency of “positive” results. At Ct values of Ct>35 the results are likely to be scientifically meaningless (Borger, et al. 2020). However, the recommendation by Corman-Drosten (2020) to the WHO was a Ct value exceeding 40; such a high Ct value standard may have been adopted by many countries despite the likelihood of inflating the number of “positives.” For example, the Ct value in the US was in the range of 37-40 and that of Japan between 40-45 cycle amplifications (Takahashi, et al. 2021 p.38). However, even at low Ct values of (e.g. Ct<25), “detection” is distinct from diagnosis of a condition or illness (Re: Mina, et al., 2021, Stang, et al., 2021).
Data: Reported vs. Actual. The daily reported figures of “positive”-coded deaths were sourced from Toyo Keizai (re: Ogiwara 2020-22); as noted in the previous section “positives” are generally referred to as 感染者 (“infected/infections” or “cases”). It has been recognized from the outset that what is referred to as the” data” refer more precisely to daily reported numbers which is distinct from daily actual numbers; there may be reporting errors and delays such that a sudden apparent increase in some number of x is solely due to improved reporting rather than an actual increase of the number of x. This may be unavoidable to a certain degree and may be less of an issue that other points detailed above.
These results are shared as a public service; if helpful consider paying it forward by adding something extra to any donations made to reputable charities, preferably with priority given to the most vulnerable, including defenseless animals. Organizational reputations may be researched through sites such as charitynavigator.org.
The author may also hold positions in securities of companies, including through ETFs, that may have been covered herein. The discussion and any visuals may contain significant errors, are subject to revisions and are provided 'as is' solely for informational purposes, not for trading or investment advice. This preliminary analysis is exploratory; no claims are made as to the validity of data, assumptions, theoretical models, and methodologies; results may be based on prior data that do not reflect the most current market or other events.
References
Abema Times, “コロナ収束を早く迎えるための“逆転の発想”? 京大准教授・宮沢孝幸氏の「ウイルスの本質を踏まえた戦略,” featured in Yahoo News Japan, May 2, 2020 (Miyazawa, Hiroyuki).
Achtenbach, Joel., "Antibody tests support what's been obvious: Covid-19 is much more lethal than the flu," Washington Post, April 29, 2020.
Akhwale JK, et al. (2019) “Comparative genomic analysis of eight novel haloalkaliphilic bacteriophages from Lake Elmenteita, Kenya.” PLoS ONE 14(2): e0212102. //doi.org/10.1371/journal.pone.0212102
Alexander, Paul Elias., "150 Research Studies Affirm Naturally Acquired Immunity to Covid-19: Documented, Linked, and Quoted," Brownstone dot org, October 17, 2021. //brownstone.org/articles/79-research-studies-affirm-naturally-acquired-immunity-to-covid-19-documented-linked-and-quoted/
Andersen, K.G., Rambaut, A., Lipkin, W.I. et al. The proximal origin of SARS-CoV-2. Nat Med 26, 450–452 (2020). //doi.org/10.1038/s41591-020-0820-9 (Issue date: April 2020)
Bar-Yam, Y., Norman, J., Taleb, N.N., “Systemic risk of Pandemics via Novel Pathogens-Coronavirus: A Note,” New England Complex Systems Institute, 2020.
Bendavid, Eran., Mulaney, Bianca., et al. "COVID-19 Antibody Seroprevalence in Santa Clara County, California", medRxiv preprint, posted April 17, 2020, *Department of Medicine, Stanford University.
Benjamin J. Cowling, Benjamin J., Fang, Vicky J., et al., Increased Risk of Non-influenza Respiratory Virus Infections Associated with Receipt of Inactivated Influenza Vaccine, Clinical Infectious Diseases, Volume 54, Issue 12, 15 June 2012, Pages 1778–1783, //doi.org/10.1093/cid/cis307.
Berenson, Alex., The light at the end of the mRNA vaccine tunnel looks more like a train every day, Unreported Truths, Substack, March 19 2022. *https://alexberenson.substack.com/p/the-light-at-the-end-of-the-mrna/comments
Borger, Pieter, et al., "External peer review of the RTPCR test to detect SARS-CoV-2 reveals 10 major scientific flaws at the molecular and methodological level: consequences for false positive results," Review report Corman-Drosten et al. Eurosurveillance 2020, (//cormandrostenreview.com), November 27, 2020.
Bristow, Michael., “Coronavirus: Japan doctors warn of health system ‘breakdown’ as cases surge, BBC News, April 18, 2020.
Britton, Tom., Ball, Frank., Trapman, Pieter., "A mathematical model reveals the influence of population heterogeneity on herd immunity to SARS-CoV-2," Science, Vol 359 issue 6505, August 14, 2020, pp 846-849.
Buisseret, Anna (de)., re: crimes against humanity; archived File (Audio) //web.archive.org/web/20220122014627/https://bluecat.media/biggest-crimes-against-humanity-ever-committed-anna-de-bouisseret-explains-who-will-be-held-liable-under-the-law/ (2022)
Bullard, Jared, et al., “Predicting Infectious Sevre Acute Respiratory Syndrome Coronavirus 2 From Diagnostic Samples,” 2020. Clinical Infectious Diseases, ciaa638, //doi.org/10.1093/cid/ciaa638
Campbell, John., M.D., “Miracle in Japan,” Dr. John Campbell on YouTube, November 23, 2021.
Chudov, Igor., "Depopulation of Taiwan," Substack June 27, 2022. *https://igorchudov.substack.com/p/depopulation-of-taiwan
Chunichi News, "5.9% of Antibodies Positive," (in Japanese), Nagoya, Japan, April 30, 2020.
Cirillo, Pasquale., Taleb, Nassim Nicholas., Tail Risk of Contagious Diseases, Nature Physics 16, 606-613, May 25, 2020.
Collins, James J., Wong, Felix., "Evidence that coronavirus superspreading is fat-tailed,” Proceedings of the National Academy of Sciences (PNAS), Nov 2020, 202018490; DOI: 10.1073/pnas.2018490117.
Corman, Victor M., Drosten, Christian., et al. "Detection of 2019 novel coronavirus (2019-nCoV) by real-time RT-PCR." Euro Surveillance 2020;25(3).
Cripps, Sally., Ioannidis, John., Tanner, Martin., "Forecasting for COVID-19 has failed," Forecasting News, International Institute of Forecasters, June 14th, 2020.
Davies, N., Jarvis, C., et al., "Increased mortality in community-tested cases of SARS-Cov-2 lineage B.1.1.7", Nature, May 2021. (Re: variants, also Frampton, et al, 2021)
Dopp, Kathy., "Informed Consent is Required for Experimental Vaccines, Face Masks, & PCR Tests," Compilation of Scientific and Medical Research, Data, & Reports by Mathematician Kathy Dopp. //www.kathydopp.info/COVIDinfo/Vaccines/InformedConsent
Dreher, Arielle., "Spokane Regional health District says report of child death from COVID-19 was incorrect," Spokesman, June 3, 2021.
ENE-COVID study Spain (see Pollán, et al.)
Frampton, D., Rampling, T., et al., "Genomic Characteristics and Clinical Effect of the Emergent SARS-CoV-2 B.1.1.7 Lineage in London, UK: A Whole-Genome Sequencing and Hospital-based Cohort Study," Lancet Infectious Diseases (online), April 12, 2021. (Re: variants, also Davies, et al, 2021)
Friston, Karl (see Sayers June 4, 2020)
Fuellmich, Reiner. et al., Coronavirus Investigative Committee (Stiftung Corona Ausschuss), Documents, 2022.( corona-ausschuss.de/en/documents/)
Giannessi, Flavia, et al., “The Role of Extracellular Vesicles as Allies of HIV, HCV and SARS Viruses,” Viruses, 2020 May, 12(5), 571.
Grifoni, A., Sidney, J., Vita, R., et al., “SARS-CoV-2 Human T-Cell Epitopes: Adaptive Immune Response against Covid-19,” Journal Pre-Proof for Cell Host and Microbe, 2021.
Hope-Simpson, R.E., Golubev, D.B., “A New Concept of the Epidemic Process of Influenza A Virus,” Epidem. Inf. 99, 5-54, March 1987.
Jaafar, Rita., Aherfi, Sarah., et al., "Correlation between 3790 qPCR positives samples and positive cell cultures including 1941 SARS-CoV-2 Isolates," Clinical Infectious Diseases, September 2020.
Karolinska Institute (see Sekine, Takuya., Perez-Potti, André., et al., also Schraer, Rachel).
Kaufman, Andrew., Statement on Viral Isolation (see Morell, et al.)
Kennedy, Raoul., “Epidemiology and Economy: Covid-19 at One Year and Beyond,” June, 2021; "Cautionary Stress Testing: Epidemiology And Economy (COVID-19 At 15 Months), Seeking Alpha, May 20, 2021 (streamlined report).
Kirsch, Steve., Bhakdi/Burkhardt pathology results show 93% of people who died after being vaccinated were killed by the vaccine," Steve Kirsch's Newsletter, December 29, 2021.
Kirsch, Steve., "Why won't the CDC or FDA reveal the VAERS URF?," monograph, skirsch dot com, 2022. //www.skirsch.com/covid/URF.pdf
Klok, Frederikus., Pai, Menaka, Huisman, Menno, Makris, Michael., "Vaccine-induced immune thrombotic thrombocytopenia," Lancet Haematol. 2022 Jan; 9(1): e73–e80. //www.ncbi.nlm.nih.gov/pmc/articles/PMC8585488/
Lam, T. T. et al. Identifying SARS-CoV-2 related coronaviruses in Malayan pangolins. Nature DOI://doi.org/10.1038/s41586-020-2169-0 (2020)
Li, Maojiao et al., “Extracellular Vesicles Derived from Apoptotic Cells: An Essential Link Between Death and Regeneration,” Frontiers in Cell and Developmental Biology, October 2, 2020.
Macrotrends dot net, country population data to 2021.
Majdoubi, A., Michalski, C., et al., "A majority of uninfected adults show preexisting antibody reactivity against SARS-CoV-2," Journal of Clinical Investigation (JCI Insight) Research Article, March 15, 2021.
Martensen, Chris., “Covid-19: A Result of Lab Manipulation?” Peak Prosperity, /youtu.be/eD3ztjqYGbg, May 13, 2020
Martensen, Chris., "Good News! Up To 50% Of Us May Be 'Pre-Immune' To Covid-19," Peak Prosperity online (//youtu.be/G7TWiweluwA), August 18, 2020.
Martin, David., “Dr. David Martin-Attorney General Document- Filing Instructions for U.S. and Commonwealth Nations, Published by Auto on 23 December 2021,” unshackledminds dot com. //unshackledminds.com/dr-david-martin-attorney-general-document-filing-instructions/
Martin, David., //www.davidmartin.world/wp-content/uploads/2021/12/The-Criminal-Conspiracy-of-Coronavirus.pdf
Melendez, Lauren.,"IDPH Director explains how Covid deaths are classified," 25WEEK, April 20, 2020. (Ezike, Ngozi, M.D.) //week.com/2020/04/20/idph-director-explains-how-covid-deaths-are-classified/
Mina, MJ, Peto, TE, et al., "Clarifying the evidence on SARS-CoV-2 antigen rapid tests in public health responses to COVID-19," Lancet, 2021.
Morell, S.F., Cowan, T., Kaufman, A., Statement on Virus Isolation (SOVI), andrewkaufmanmd.com/sovi/
Murphy, William., Longo, Dan., “A Possible Role for Anti-idiotype Antibodies in SARS-CoV-2 Infection and Vaccination," N Engl J Med, January 27, 2022, 386:394-396
Ogiwara, Kazuki., “Coronavirus Disease (COVID-19) Situation Report in Japan,” Toyo Keizai Online, 2020-22.
Pollán, Marina, M.D.., Pérez-Gómez, Beatriz, M.D., et al., “Prevalence of SARS-CoV-2 in Spain (ENE-COVID): A nationwide, population-based seroepidemiological study,” The Lancet, July 2, 2020.DOI://doi.org/10.1016/S0140-6736(20)31483-5
Sayers, Freddie., “German Virologist: Covid-19 Less Deadly than Feared,” The Post (Unherd), May 5, 2020 (//unherd.com/thepost/german-virologist-finds-covid-fatality-rate-of-0-24-0-36/)
Sayers, Freddie, “Karl Friston: Up to 80% not even susceptible to Covid-19,” The Post (Unherd), June 4, 2020. (//unherd.com/2020/06/karl-friston-up-to-80-not-even-susceptible-to-covid-19/)
Schraer, Rachel., “Coronavirus: Immunity may be more widespread than tests suggest,” BBC News Health, July 1, 2020. (Re: Karolinska Insitute)
Streeck, Hendrik., (see Sayers, May 5, 2020).
Sekine, Takuya., Perez-Potti, André., et al. “Robust T cell immunity in convalescent individuals with asymptomatic or mild COVID-19,” bioRxiv, online 29 June 2020 (doi: 10.1101/2020.06.29.174888).
Stang, Andreas., et al., "The performance of the SARS-CoV-2 RT-PCR test as a tool for detecting SARS-CoV-2 infection in the population," Journal of Infection, May 30, 2021.
Takahashi, Toku., Nakamura, Atsushi., Funase, Shunsuke., Korona wakushinu no osoroshisa (in Japanese), 2021.
Taleb, Nassim., "On single point forecasts for fat tailed variables," Forecasting News, International Institute of Forecasters, June 14th, 2020.
Taleb, Nassim., Statistical Consequences of Fat Tails: Real World: Preasymptotics, Epistemology, and Applications, STEM Academic Press, 2020.
World Population Review, country population data to 2020.
Note on references: Online references may exclude “https.” Some dates may vary slightly according to time zone differences. If a date is not clearly indicated in an online reference, the most recent year of access will be shown. If an author name is not made available for a page (online), either the online publication name or the name of the principal individual being covered is used. The addition of citations or references does not imply endorsement or agreement with the entirety of a source or author’s views. Some of the studies cited may not be peer-reviewed; authors may be listed in references according to the order shown in the study and not alphabetically.
For a report on South Korea, see https://alexberenson.substack.com/p/the-light-at-the-end-of-the-mrna/comments
For a report on Taiwan see https://igorchudov.substack.com/p/depopulation-of-taiwan